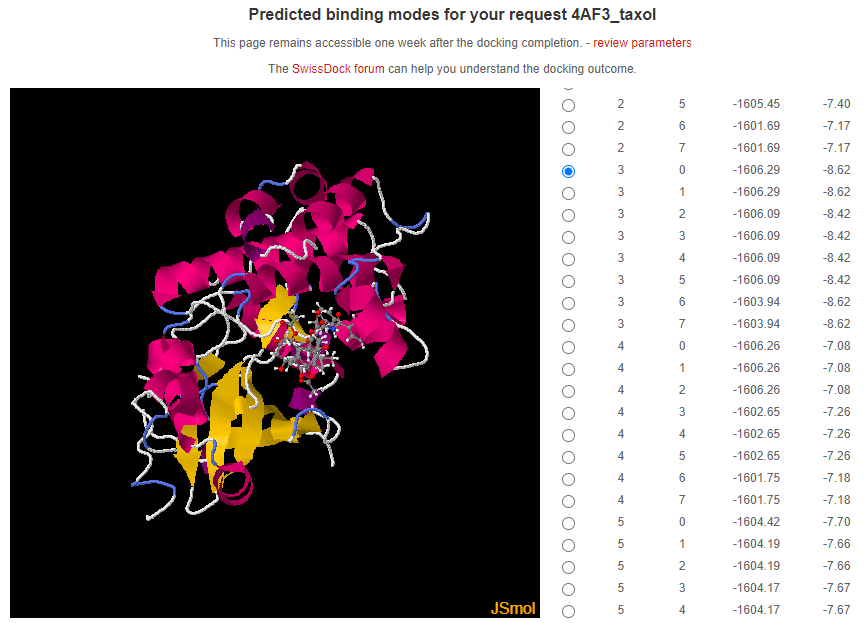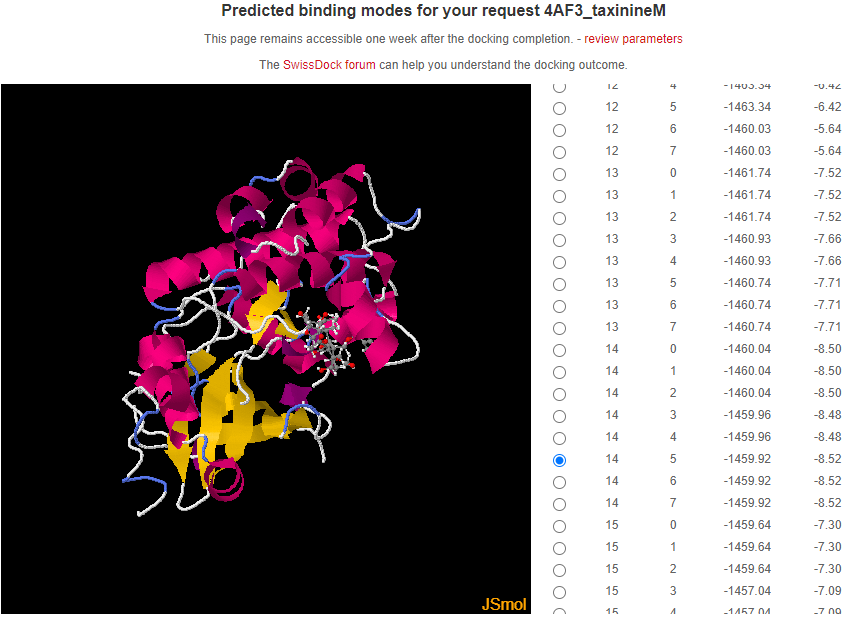


Hem estudiat i descarregat la proteina amb Codi PDB 4AF3
4AF3 es un kinasa es a dir, un tipus d'enzim (proteïna que accelera les reaccions químiques en el cos) que afegeix substàncies químiques anomenades fosfats a altres molècules, com a sucres o proteïnes .
Aquesta proteina volem bloquejarla per impedir el cancer i mesurar l'energia d'unio en kilocalorìes-mol quan mes negatiu sigui les kilocalories-mol mes bo sera moc anticancerigen
Aquests son els resultats obtinguts de acoplament molecular al institut suis de bioinformàtica amb el software Swissdock
Aqui tens el codi que ha gerenerat la imatge de mes amunt
Abans de posar el codi expliquem que esta fet a ggogle.colab on puc triar python o R i CPU o GPU en notebook settings. La GPU és més util en deeplerning perque permet procesment paral·lel o simultani de codi i la CPU és la unitat de procesament del computador i pot tenir diversos nuclis pero és més lenta en deeplearning o visió per ordinador
Si vull descarregar al google.colab ho puc fer i es descarregara en format IPYNB que significa Interactive Python Notebook.Aquest arxiu es pot obrir amb un editor Jupyter que es pot instalar en ordenador descarregant ANACONDA. Hi ha dos versions Jupyter: Jupyter Notebook i Jupyter Lab que es poden descarregar localment en el orrdinador i tenen el mateix aspecte i funcionalitat que google colab amb la aventatge pi inconvenient de utilitzar totes les capasitats del teu ordinador.
Com a conclusió treiem que la proteïna 4AF3 reacciona amb més efectivitat amb la molècula Taxinina H (-8.63 kcal/mol)
 # 2. Upload deltaG_values.csv of every docking to generate a boxplot to obtain a summary table transposed data in csv and boxplot
# Has de pujar els diferents arxius i penjar cancel quan acabis, posar els noms en català (en aquest exemple: Taxinina A, etc)
# Després has d'escriure el codi PDB de la teva proteïna (en aquest exemple 4HFZ)

from google.colab import files
import pandas as pd
import matplotlib.pyplot as plt
import io
import numpy as np

# Initialize an empty list to store DataFrame objects
dfs = []

# Upload CSV files one by one
print("Upload CSV files one by one. Press Cancel to stop uploading.")
while True:
    uploaded_files = files.upload()
    if len(uploaded_files) == 0:
        break
    for filename, contents in uploaded_files.items():
        # Read CSV file as DataFrame and append it to the list
        df = pd.read_csv(io.StringIO(contents.decode('utf-8')), header=None)
        # Add a column to identify the compound
        df['Compound'] = f'Compound {chr(ord("A") + len(dfs))}'
        dfs.append(df)

# Concatenate DataFrames vertically
combined_df = pd.concat(dfs, ignore_index=True)

# Transpose the DataFrame so that rows become columns
transposed_df = combined_df.set_index('Compound').T

# Save the transposed DataFrame to a new CSV file
transposed_csv_path = 'transposed_data.csv'
transposed_df.to_csv(transposed_csv_path)

# Prompt the user to enter real chemical names for each compound
real_names_mapping = {}
for i, df_name in enumerate(transposed_df.columns):
    real_name = input(f"Enter the real chemical name for {df_name}: ")
    real_names_mapping[df_name] = real_name

# Prompt the user to enter the last word of the graph title
graph_title_suffix = input("Enter the last word of the graph title: ").strip()

# Create a customized boxplot for compounds
plt.figure(figsize=(8, 6))

# Set colors
box_color = 'blue'
median_color = 'orange'
whisker_color = 'green'
cap_color = 'purple'

# Create a boxplot
boxprops = dict(color=box_color)
medianprops = dict(color=median_color)
whiskerprops = dict(color=whisker_color)
capprops = dict(color=cap_color)
boxplot = transposed_df.boxplot(vert=False, return_type='dict', boxprops=boxprops, medianprops=medianprops, whiskerprops=whiskerprops, capprops=capprops)

# Overlay individual data points
for df_name in transposed_df.columns:
    y = np.random.normal(list(transposed_df.columns).index(df_name) + 1, 0.1, size=len(transposed_df[df_name]))
    plt.scatter(transposed_df[df_name], y, alpha=0.5, s=10)

# Set ticks and labels
plt.yticks(np.arange(1, len(transposed_df.columns) + 1), [real_names_mapping[col] for col in transposed_df.columns])

plt.xlabel("Energia d'unió (kcal/mol)")
plt.ylabel("Lligands")
plt.title(f"Acoblament molecular amb proteïna PDB {graph_title_suffix}")
plt.grid(True)
plt.axvline(x=0, color='red', linestyle='--')  # Add line at 0 for reference
plt.tight_layout()

# Save the plot as an image file
plot_image_path = 'boxplot.png'
plt.savefig(plot_image_path)

# Download the transposed CSV file and the plot image
files.download(transposed_csv_path)
files.download(plot_image_path)

# Print paths to the saved files
print("Transposed data saved to:", transposed_csv_path)
print("Plot image saved to:", plot_image_path)